Be patient we are still growing
And we hope to introduce more features as the time goes by.
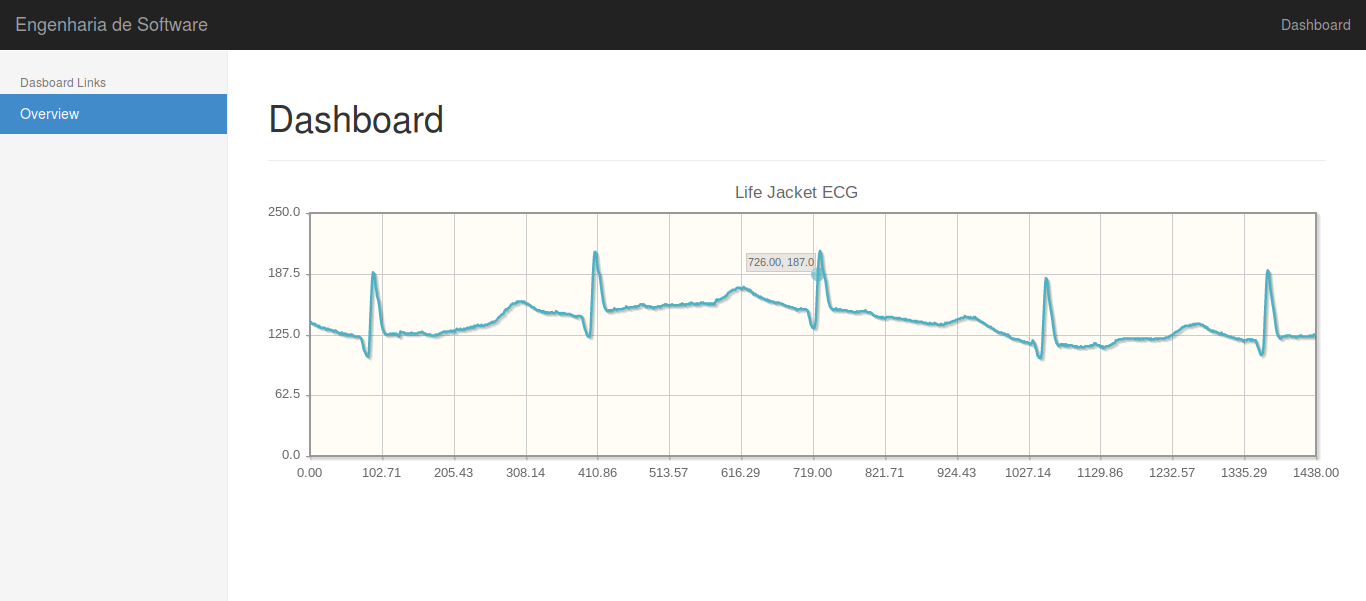
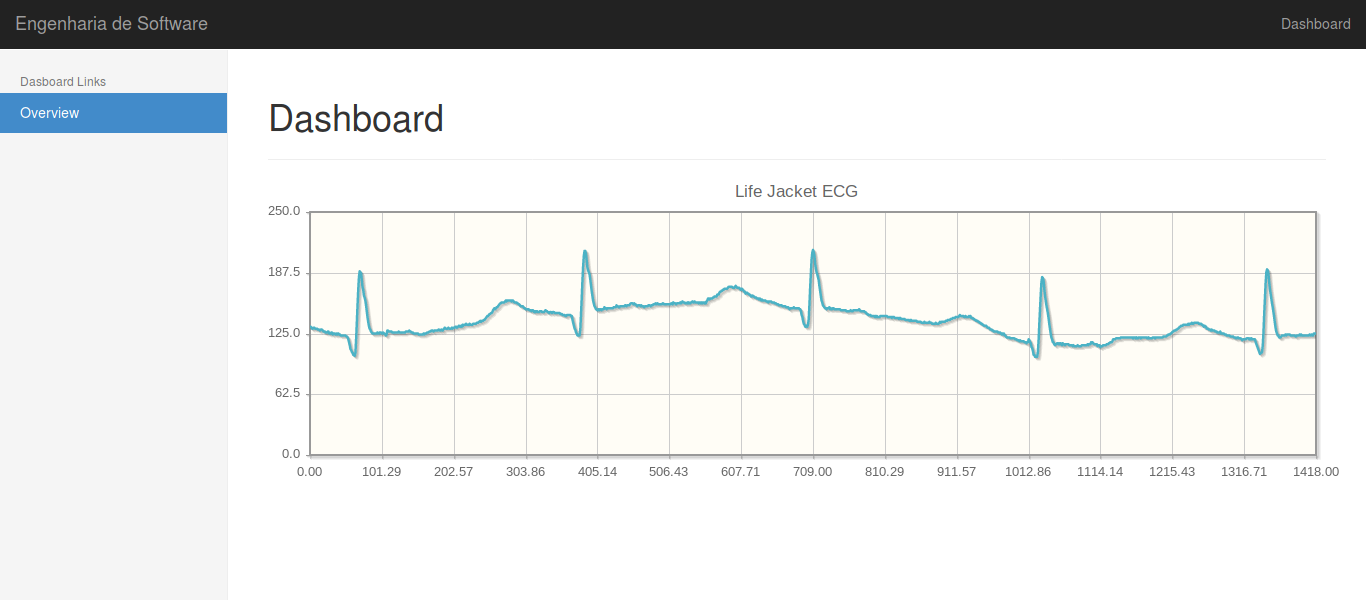
Dashboard view
The dashboard it's pretty simple, it may need some glitter but you just need to know that the x axys represent ms and the y axys represent the scale of the ecg thingy, we still need to ask the experts.
Dashboard interaction
With your mouse button you can pin point every point of the graph.